Timeline
| This panel is experimental! Layout and functionality might change without notice. |
The Timeline panel contains interactive charts about the time evolution of the loaded drone show.
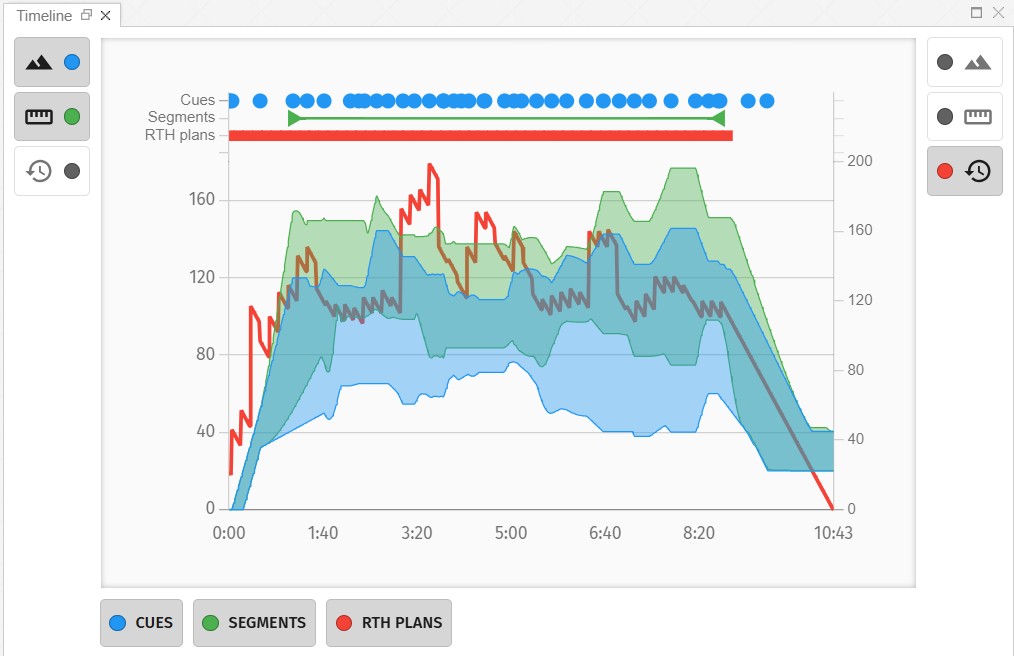
The following timeline charts can be enabled with the buttons on the left and right sides, each with a vertical axis on the corresponding side:
-
Altitude range of the UAVs in the show
-
Distance from home range of the UAVs in the show
-
Duration of collective RTH from the given moment
The following extra show metadata can also be visualized at the top, using the buttons at the bottom:
-
Timestamps of cues
-
Time span of the net show segment
-
Timestamps when collective RTH plans are available
The color of each chart or metadata item matches the color indicator of its corresponding button.